We're not chart-makers (and we never were)
How information designers can move beyond chart-making to become strategic partners
Last month I spoke at Outlier about how our roles are evolving. Here's the framework I shared, and why I think we're finally moving beyond the limitations of "chart-maker."
For ten years, whenever someone asked what I do, I'd say: "I make pretty charts."
That description just doesn't fit anymore. Making charts has become a tiny fraction of day, not so much because I lead a team now, but because what clients actually need from me has changed completely.
The shift
We're all feeling it. The landscape has changed.
We're no longer the only ones who can make a good-looking chart or map. Marketing teams have drag-and-drop tools like Datawrapper or Flourish. There are many chart libraries out there, AI can even write decent enough D3 code.
What once required a developer or designer weeks of work can now be done in an afternoon by someone with zero design training.
But here’s my hot take: that visual output was never the point. It was always about the process behind it.
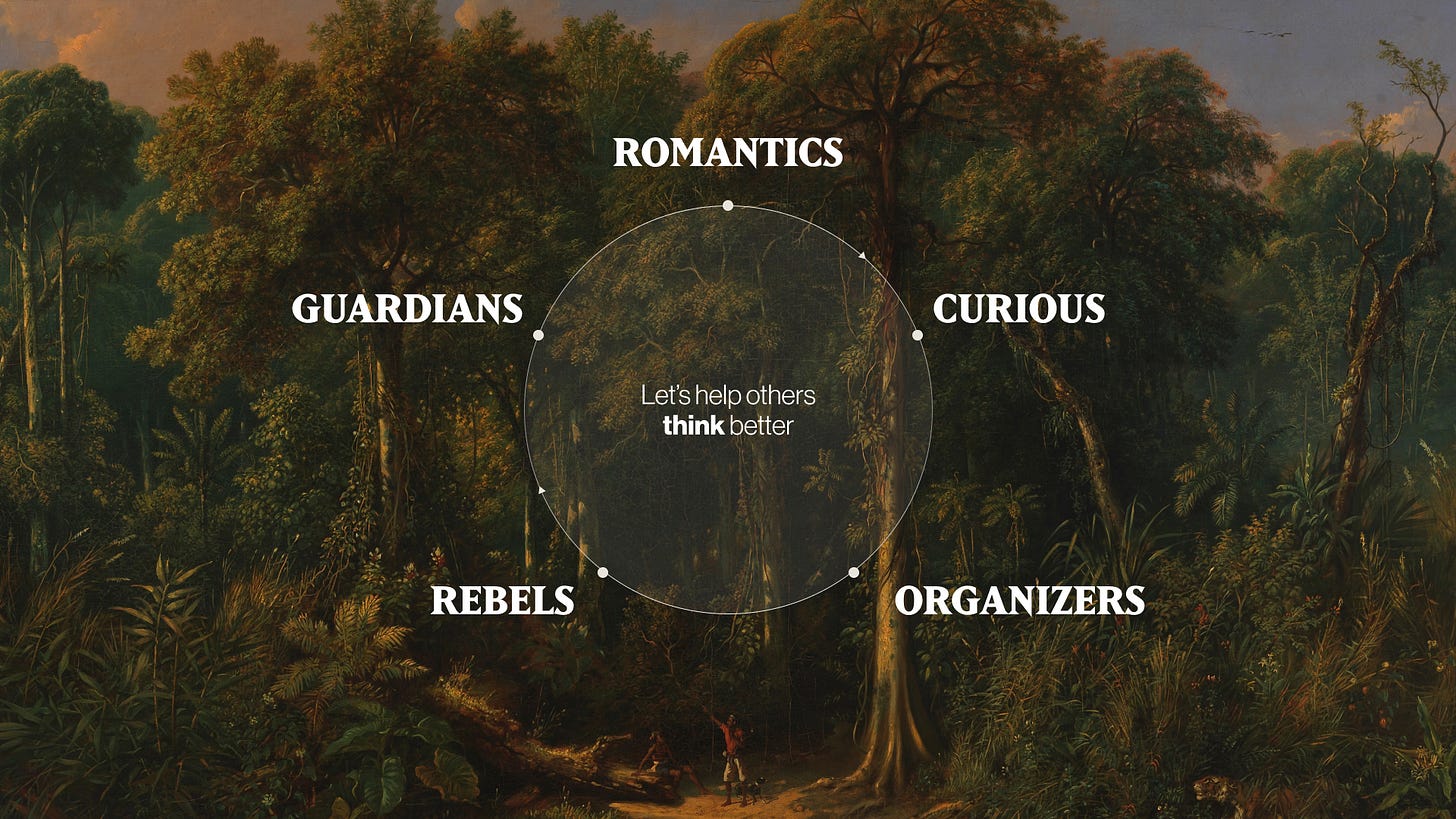
One title, 5 roles
That I've learned over ten years is that we, either as independent player or as a team, already play multiple roles, we just don't name them. In any given project….
….We are romantics
We fall in love with weird, cold objects in tables. With complexity that doesn't make sense yet.
This matters because in most organizations, no one is in love with the data. And we have to be okay with the fact that we don't need to make them fall in love with data. We need to fall in love with outcomes. With the people our work affects.
….We are detectives.
We're professional skeptics who ask the right questions.
I’m not talking about questioning the data anymore but about understanding the outcome of using it. We need to investigate why the work needs to exist in the first place. What's the invisible fire, the pressure driving this request? What's keeping the person who called you up at night?
Sometimes it takes digging through five or six layers of "why" before we get to the truth.
….We are organizers.
We take chaotic data sheets and turn them into structured tables. But that's just one level of organization.
Some of us go further and are used to organize narrative flows, user journeys and more… but those have to do with the output.
Today, we can use our expertise to help organizing how entire corporations use knowledge: to design the processes and relationships that turn information into decisions. One of the most powerful maps I've ever made had no data at all. Just stakeholders and their relationships to each other (who influences who? who’s our ally in this process? who’s a skeptic?).
….We are rebels.
Not the loud kind. The thoughtful kind.
We make subtle acts of rebellion in service of clarity and integrity. Sometimes it's tweaking that brand color palette just an inch to make it accessible. Sometimes it's building what's actually needed, templates, guidelines, brief… before anyone realizes they need it.
….We are guardians.
We protect meaning.
We create mindful friction* to slow people down just enough to ask: "Is this right? Is this ethical? Is this clear?" It's the quiet practice of embedding intention into systems.
What this really means
The five roles aren't a linear ladder. They're a cycle: Love → Curiosity → Structure → Challenge → Stewardship.
Maybe you're spending all your time organizing messy data, stuck in structure. Or maybe you're rebelling constantly but haven't paused to ask why (that’s me!).
We have the skills. We just need to embrace them and reposition ourselves as essential thinkers in the room.
We shape not just what people see, but how they think.
Because no tool can care. No template can advocate. No AI can fall in love with a messy, meaningful problem and stay with it long enough to shape something better.
So let’s show up as partners who bring curiosity, structure, care, and challenge…that's our competitive advantage.
‘Till next time,
Gabby
🫂 People who shaped this talk
Thanks to the people who shaped this thinking: Nikkia Reveillac, Todd Lindeman, Jessica Wey, Moritz Stefaner, Jae Henderson, Alan Wilson, Dan Mall, Timour Screve and Martina Klančišar.
📗 Resources that shaped this talk
Stuck? Diagrams Help and How to make sense out of any mess by Abby Covert
Making Sense of Field Research: A Practical Guide for Information Designers by Sheila Pontis. I should write about this sometimes, it’s a wonderful resource.
All content created by If (*who came up with the concept of mindful friction)
Managing Chaos: Digital Governance by Design by Lisa Welchman
Are you a romantic who falls in love with weird datasets? An organizer who can't help but map everything? Email me and tell me which one feels most like your natural mode. I’m always curious to hear how this framework lands.


